eZ Components - Debug
Table of Contents
Introduction
The Debug component provides an API to log and time debug events. This component depends mainly on the EventLog component. The functionality of the Debug component is divided into two parts:
Writing debug messages.
Measuring the execution time.
Writing a debug message is almost the same as writing a message with the EventLog component. However, there is one major distinction: messages written with the EventLog component are intended to be written to a storage element (such as a log file or database). Messages written with the Debug component are usually directly formatted and displayed. Note that the Debug::log() method has a slightly different signature than the EventLog::log() method.
Timing information is captured by starting and stopping timers using the public methods from ezcDebug. The timing information is stored in a structure with raw data. This structure should be formatted and displayed at the end of the script.
The Debug summary output can be formatted with an implementation from ezcDebugOutputFormatter. The default, and currently only, formatter is ezcDebugHtmlFormatter. This HTML formatter transforms the raw log messages and raw timing information into a HTML string for display.
Class overview
The following classes are the most important to use, extend or implement:
- ezcDebug
- This provides the public API for writing Debug messages and capturing timing information.
- ezcDebugOptions
- Allows you to switch on debug stack traces and to configure their appearance.
- ezcDebugOutputFormatter
- ezcDebugOutputFormatter provides an interface for the debug output format. New implementations can format the raw log messages and timing information to any output format.
- ezcDebugHtmlFormatter
- ezcDebugHtmlFormatter is an implementation of the ezcDebugOutputFormatter interface. This formatter reads the raw log and timing information and returns it as an HTML string. This string can be output directly to an HTML page.
See the API documentation for more information.
Usage
Writing a log message to file
The following script writes a message to the Debug component. At the end of the script, the log message is formatted and printed.
- <?php
- require_once 'tutorial_autoload.php';
- date_default_timezone_set( "UTC" );
- // Get the one and only instance of the ezcDebug.
- $debug = ezcDebug::getInstance();
- // Write a log message with verbosity 1.
- $debug->log( "Connecting with the Payment server", 1 );
- $debug->log( "Connected with the Payment server", 2, array( "source" => "shop", "category" => "payment" ) );
- // Get HTML output.
- $output = $debug->generateOutput();
- echo $output;
- ?>
Writing log messages is almost the same as writing them to the EventLog component. As a matter of fact, the EventLog component is internally used by Debug.
Further information about writing log messages can be found in the EventLog component.
Timers
The timers from ezcDebug can be used for two purposes:
Timers measure the time between two points in the program.
Accumulators get the current time after a certain point (for example after starting the script).
Both methods are executed with ezcDebug::startTimer(), ezcDebug::stopTimer() and ezcDebug::switchTimer(). The next script demonstrates the usage of these methods:
- <style type="text/css">@import url("example_stylesheet.txt");</style>
- <?php
- require_once 'tutorial_autoload.php';
- date_default_timezone_set( "UTC" );
- // Get the one and only instance of the ezcDebug.
- $debug = ezcDebug::getInstance();
- // Start the accumulator.
- $debug->startTimer( "Program runtime", "Accumulators" );
- $debug->switchTimer( "Start", "Program runtime" );
- // Measure the time of writing "hello world".
- // The name of the timer is: "Hello world" and it will be placed in the group: "output".
- $debug->startTimer ("Hello world", "output" );
- echo "Hello world<br/>";
- $debug->stopTimer( "Hello world" );
- // Replace the "Start" timer for "Half the way".
- $debug->switchTimer( "Half the way", "Start" );
- // Measure the time of writing "cruel world".
- $debug->startTimer( "Goodbye cruel world", "output" );
- echo "Goodbye cruel world<br/>";
- $debug->stopTimer( "Goodbye cruel world" );
- // Stop the last timer.
- $debug->switchTimer( "Stop", "Half the way" );
- $debug->stopTimer( "Stop" );
- // Get HTML output.
- $output = $debug->generateOutput();
- echo "<br/><br/>";
- echo $output;
- ?>
The output is as follows (if the CSS stylesheet is used that is available through "Example Stylesheet" in the menu):
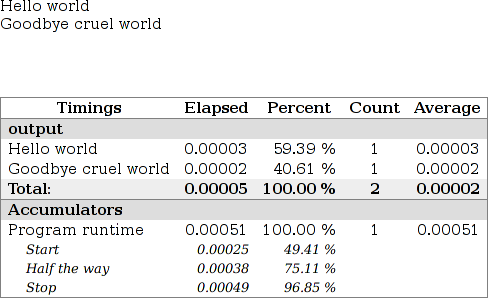
The output has two groups: output and accumulators. There are two timers in the "output" group: "Hello world" and "Goodbye cruel world".
The "accumulators" group has one timer called "Program runtime". This timer took a total of 0.00034 seconds. In this timer are several "switch timers". These show the time since the "Program runtime" was started.
Recursive timers
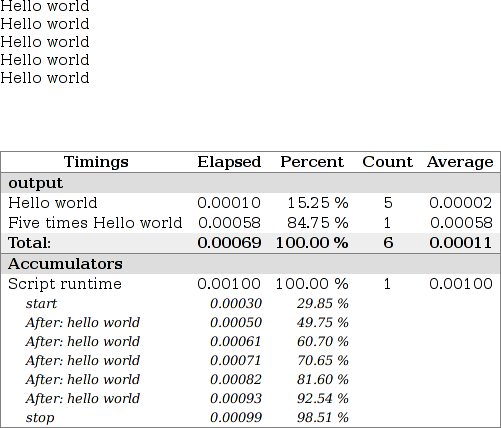
You can also time repeating code blocks. For example, you can measure the time a PHP statement takes in a loop. The Debug timer will calculate the average time of the repeating statement and display it in the debug summary. See the next example:
- <style type="text/css">@import url("example_stylesheet.txt");</style>
- <?php
- require_once 'tutorial_autoload.php';
- date_default_timezone_set( "UTC" );
- // Get the one and only instance of the ezcDebug.
- $debug = ezcDebug::getInstance();
- // Start the accumulator.
- $debug->startTimer( "Script runtime", "Accumulators" );
- // Store the name of the accumulator.
- $accumulatorName = "start";
- $debug->switchTimer( $accumulatorName, "Script runtime" );
- // Time the loop.
- $debug->startTimer ( "Five times Hello world", "output" );
- for( $i = 0; $i < 5; $i++ )
- {
- // Time the "Hello world" only.
- $debug->startTimer ( "Hello world", "output" );
- echo "Hello world<br/>";
- $debug->stopTimer( "Hello world" );
- // Store the accumulator.
- $debug->switchTimer( "After: hello world", $accumulatorName );
- $accumulatorName = "After: hello world";
- }
- $debug->stopTimer( "Five times Hello world" );
- // Stop the accumulator
- $debug->switchTimer( "stop", $accumulatorName );
- $debug->stopTimer( "stop" );
- // Get HTML output.
- $output = $debug->generateOutput();
- echo "<br/><br/>";
- echo $output;
- ?>
The resulting output is as follows (if the CSS stylesheet is used that is available through "Example Stylesheet" in the menu):
Stack traces
Sometimes it is useful to get a stack trace for log messages. To achieve this, there are 2 possibilities offered by the Debug component:
1) Global stack trace switch
- <?php
- require_once 'tutorial_autoload.php';
- $debug = ezcDebug::getInstance();
- // Switch on global stack traces.
- $debug->options->stackTrace = true;
- // Configure stack trace appearance.
- $debug->options->stackTraceDepth = 3;
- $debug->options->stackTraceMaxData = 32;
- $debug->options->stackTraceMaxChildren = 3;
- $debug->options->stackTraceMaxDepth = 2;
- // ... somewhere else ...
- // Log with no explicit stacktrace indication
- ezcDebug::getInstance()->log(
- 'Function testThis() has been called.',
- ezcLog::NOTICE,
- array( 'additional' => 'info' )
- );
- // ... somewhere else ...
- // Print out log with stacktraces.
- $debug = ezcDebug::getInstance();
- echo $debug->generateOutput();
- ?>
In this example, the debug options (see: ezcDebugOptions) are used to switch on stack traces globally. The effect is, that whenever a debug message is logged, a stack trace is logged in addition. When printing the debug information, stack traces in the manor of Xdebug are included in the output.
Beside the $stackTrace option itself, the appearance of the stack traces is configured. This configuration only takes effect, if Xdebug is not installed. In this case, an own implementation is used to retrieve stack traces that look almost exactly like the Xdebug version. If Xdebug is installed, its internal settings will be used.
The possible options for stack traces are:
- $stackTraceDepth
- Defines the number of nested function calls included in the trace (starting at the most recent one). This option also affects Xdebug generated stack traces. The default is 5.
- $stackTraceMaxData
- Maximum bytes of data to be dumped for variable values. The default is 512.
- $stackTraceMaxChildren
- Defines the maximum number of child elements that will be dumped for array and object structures. The default value is 128.
- $stackTraceMaxDepth
- Maximum level of iteration that is performed when dumping nested array or object structures.
2) Local stack trace switch
If stack traces are not desired with every log message, it is also possible to activate them when the log message is issued:
- <?php
- require_once 'tutorial_autoload.php';
- // ... inside some function...
- // Log with no explicit stacktrace indication
- ezcDebug::getInstance()->log(
- 'Function testThis() has been called.',
- ezcLog::NOTICE,
- array( 'additional' => 'info' ),
- // Enable stack trace
- true
- );
- // ... somewhere else ...
- // Print out log with stacktraces.
- $debug = ezcDebug::getInstance();
- echo $debug->generateOutput();
- ?>